Causalvis: Visualizations for Causal Inference
An open-source Jupyter Notebook widget to support various steps throughout a causal inference analysis workflow.
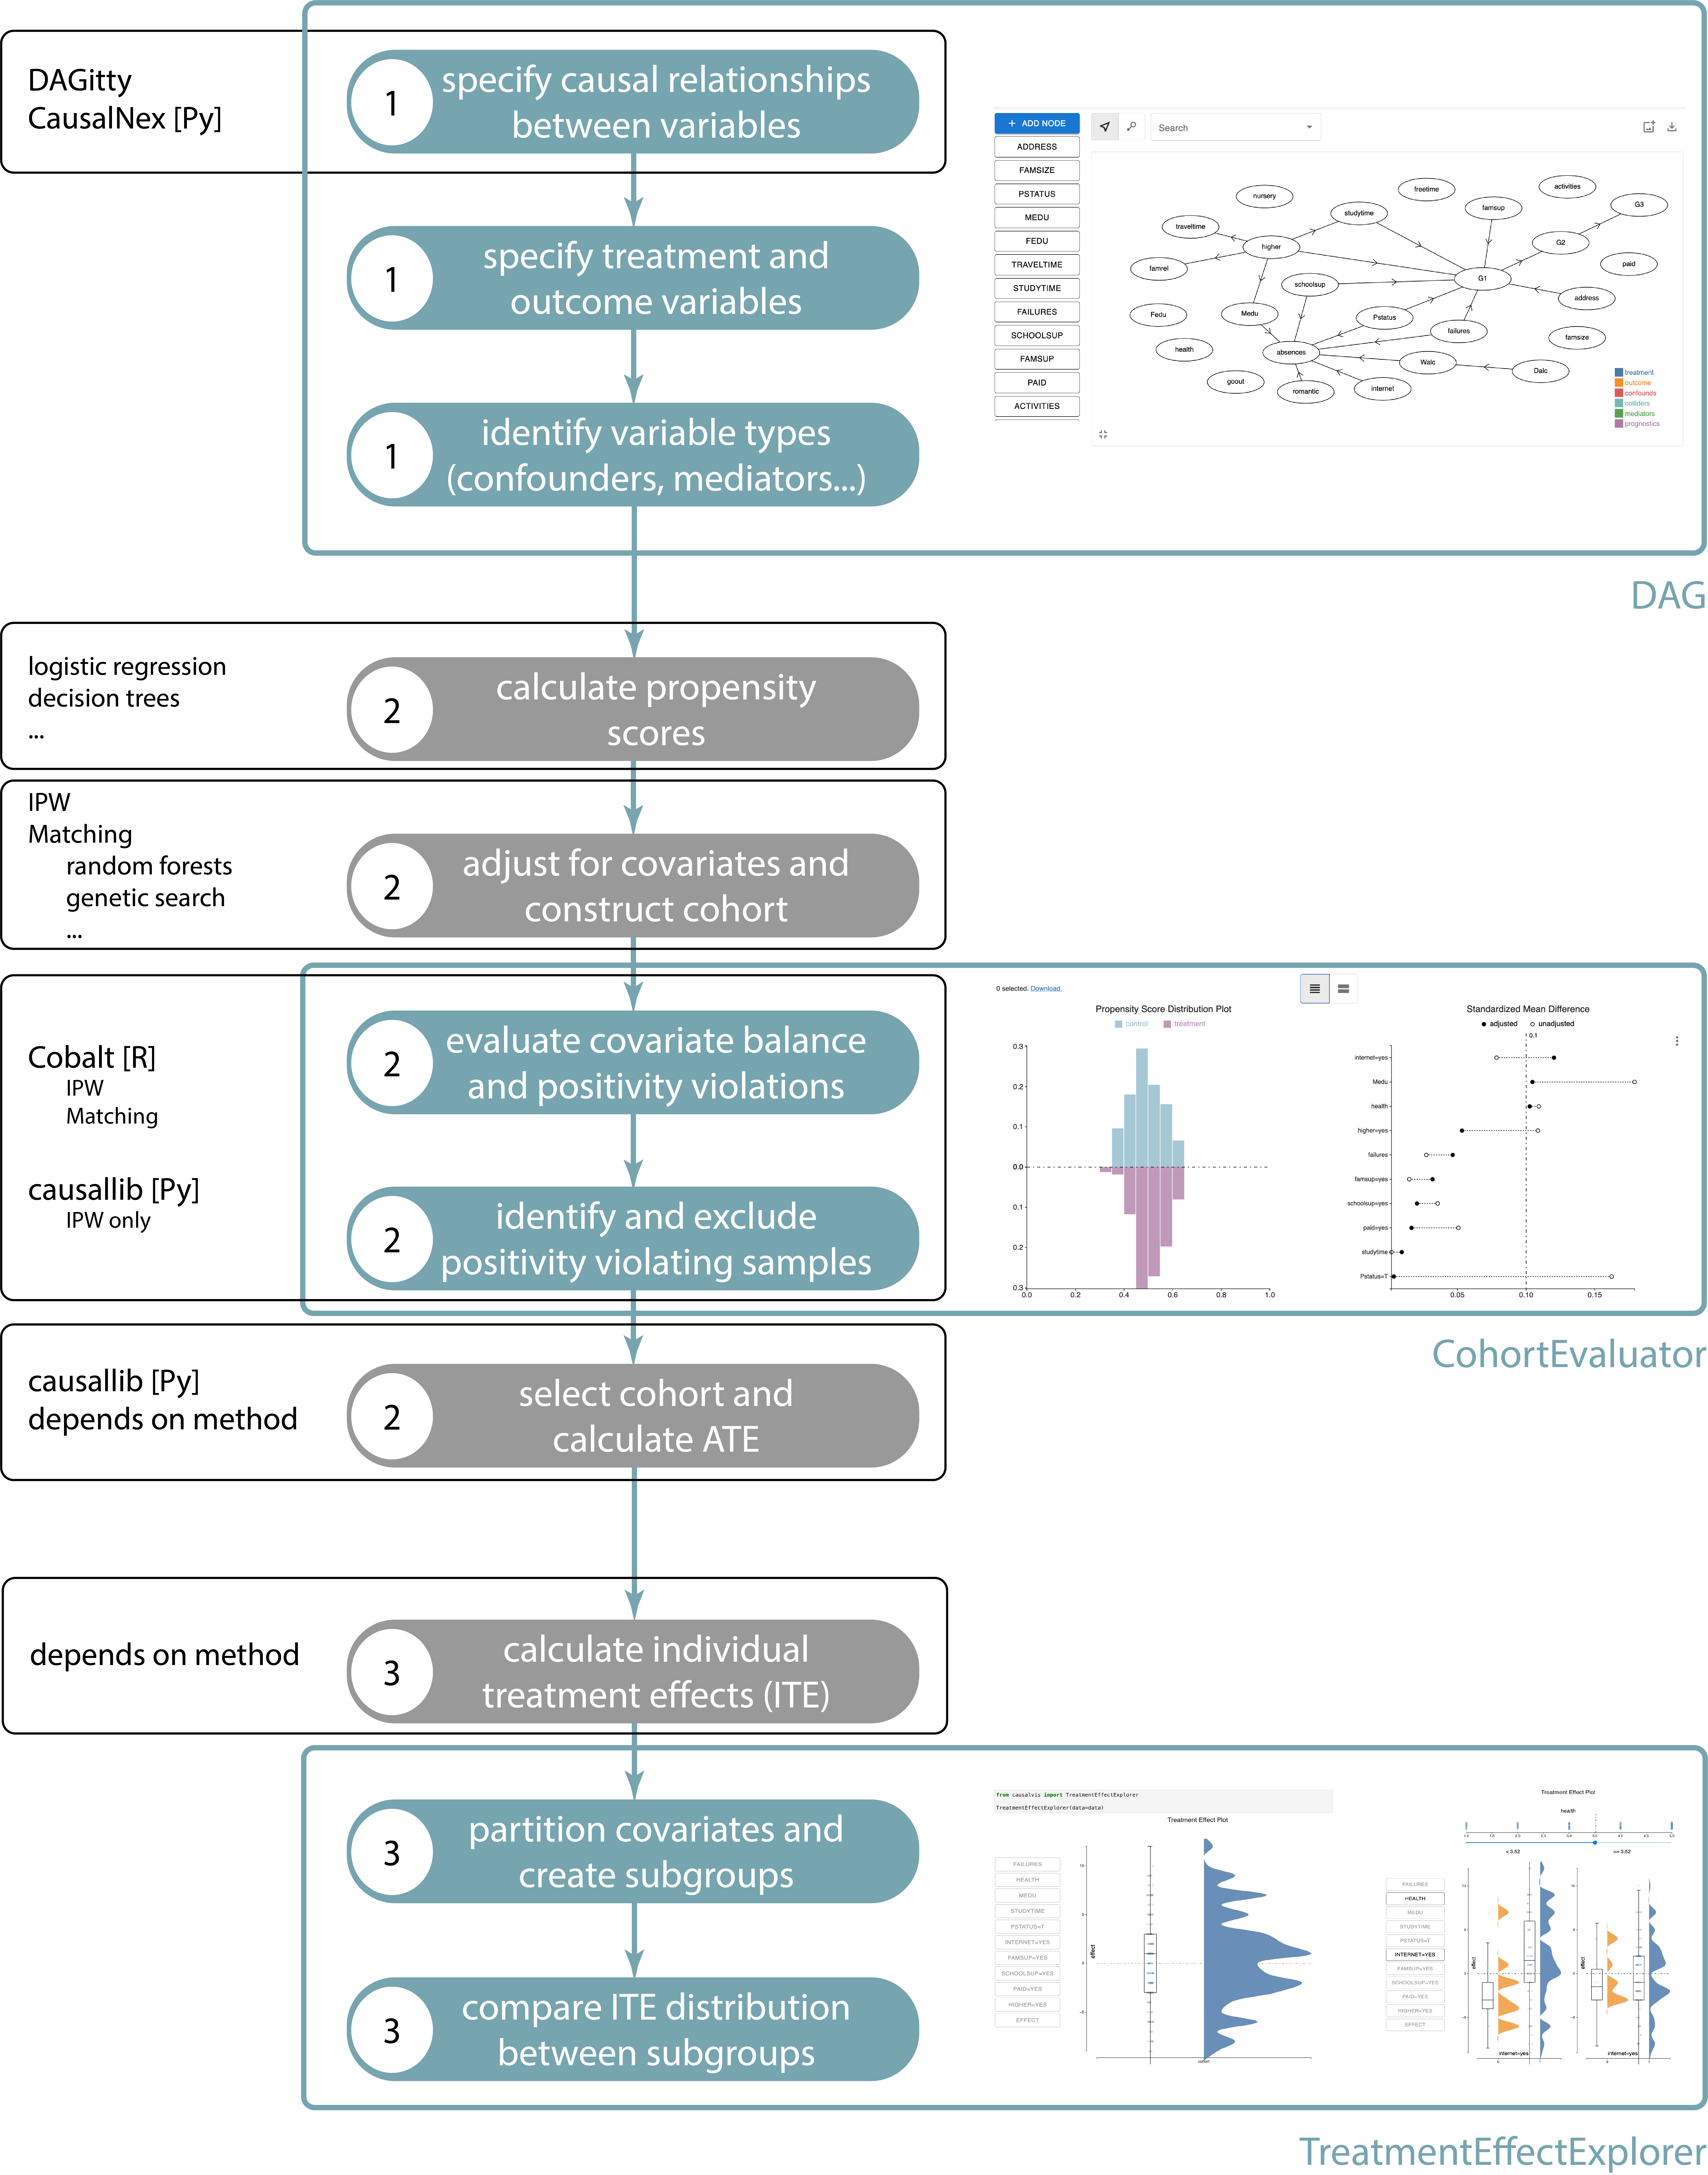
Causal inference is a statistical paradigm for quantifying causal effects using observational data. It is a complex process, requiring multiple steps, iterations, and collaborations with domain experts. Analysts often rely on visualizations to evaluate the accuracy of each step. However, existing visualization toolkits are not designed to support the entire causal inference process within computational environments familiar to analysts. In this paper, we address this gap with Causalvis, a Python visualization package for causal inference. Working closely with causal inference experts, we adopted an iterative design process to develop four interactive visualization modules to support causal inference analysis tasks. The modules are then presented back to the experts for feedback and evaluation. We found that Causalvis effectively supported the iterative causal inference process. We discuss the implications of our findings for designing visualizations for causal inference, particularly for tasks of communication and collaboration.

Citation
@inproceedings{guo2023causalvis,
  title={Causalvis: Visualizations for Causal Inference},
  author={Guo, Grace and Karavani, Ehud and Endert, Alex and Kwon, Bum Chul},
  booktitle={Proceedings of the 2023 CHI Conference on Human Factors in Computing Systems},
  pages={1--20},
  year={2023}
}